shadow

Care-Metric is the new agent for MOA Benchmarking in New Zealand

MOA is an online Quality Improvement Platform that is used by a large number of aged care facilities in Australia. The platform allows aged care providers (they call them partners) to self-assess and benchmarks their current performance against the standards, their past performance, and that of other providers using this platform. The self-assessment highlights risk and improvement opportunities that can be tracked and monitored in this digital platform for continuous improvement.

Care-Metric is proud to be the new agent for MOA in New Zealand. It has aligned its tools with the New Zealand Health and Disability Service Standards and so it becomes a useful tool to actively monitor the integrated quality of care and prepare facilities well for any (spot) audit coming to your way.

So why is Care-Metric so positive about becoming the New Zealand agent for the MOA Quality Improvement Platform?

• Care-Metric has a strong belief that the learning organisations<sup>(1)</sup> will be the most successful organisations in the future. Self-assessment and reflection are critical components in becoming a learning organisation. It will benefit the residents and staff working in these facilities. The MOA platform has this all.

• Secondly, Care-Metric embraces the way MOA benchmarking is analysing incident data. It follows the international guidelines (IHI) on this issue. Using Statistical Process Control methodology enables facilities not only to compare current outcomes with past outcomes in a sound statistical way but also they can benchmark those against other similar facilities.

• Thirdly Care-Metric is all about quality improvement. The MOA platform provides an integrated approach to this topic where it enables facilities to highlight opportunities for improvement, plan an improvement programme, measure the results, and implement the necessary changes.

Care-Metric is proud to be the agent for this well-respected Australian company of which the primary focus is to bring a valuable contribution to the aged care sector with its platform. For more information visit their website or get in touch with Care-Metric via email: Jan@care-metric.com, mobile 021-897605. We look forward to hearing from you!

If you want to hear more about what MOA-benchmarking can do for you, watch this video.


Reference

1. Jeong SH, Lee T, Kim IS, Lee MH, Kim MJ. (2007.) The effect of nurses? Use of principles of a learning organization on organizational effectiveness. Journal of advanced nursing. 58 (1), 53-62.

Eighty year olds are a blind spot in tackling coronavirus

Covid-19 has had a devastating effect on the elderly across the world. Sometimes, as our body changes with age, symptoms can change as well. If we are not aware of this, early signs can be missed and delay intervention. Here is a translated interview with Professor Marcel Olde Rikkert, Professor of Geriatric Medicine at the Radboud University and hospital, Nijmegen, The Netherlands, on this issue.

Originally published in NRC Handelsblad, 14 of May 2020
Author: Frederiek Weeda
Translation: Dr. Jan Weststrate
Editing: Kathryn Fernando


Marcel Olde Rikkert: “The elderly who have Covid-19 often show different symptoms than younger patients. Doctors were therefore put on the wrong track.”

“They have overlooked the elderly”, says Marcel Olde Rikkert. He calls it the “blind spot” in medicine. In the corona crisis – and especially in the initial phase during the great spread – they forgot how the older human body functions. “It’s as if we went back 20 years and knew nothing about geriatrics.” Olde Rikkert is a Professor of Geriatric Medicine at Radboud University Nijmegen and works in the hospital.

From December onwards, throughout the world the pandemic policy was determined by virologists, epidemiologists and infection doctors. Olde Rikkert: “All eyes were looking hopefully at them, the owners of the problem. And they looked at the virus, the exciting new virus from China: How does it spread and what does it do to organs. They did not look at the host who is most bothered by it: the elderly. While in China it immediately appeared that 85 percent of the deceased were very old.”

It was not a conscious policy, he says, rather a “mechanism that came into effect in response to an attack from an unknown angle.”

But there are now 9,053 elderly people in Dutch nursing homes infected with the virus. 1,696 of them died, professional association Verenso reported Wednesday (13-05-2020), 1,861 have recovered.

The older human body

The old body functions differently from the younger one, explains Olde Rikkert. That does not change at the same time for everyone. One is 85 but has a ‘biological age’ of 65 and is therefore relatively fit – “there are 100-year-olds recovering from Covid-19” – others are young, but have worn down organs: the lungs from smoking, the liver from drinking, diabetes from overweight. Or just because of bad luck.

But the big picture is: as the age increases, the blood vessels become narrower, the heart pumps less effectively, the blood flows less quickly and organs, and other parts such as brains and joints wear out. On average, eighty year olds have a body temperature of 35 to 36 degrees. The blood flow is restricted, so they are cold. If an eighty year old measures 37 degrees, she will have a fever if she is normally at 35 degrees. “But the corona guidelines of RIVM1  and WHO to this day speak of a corona suspicion from a body temperature of 38 degrees. This is not relevant for the elderly, ”says Olde Rikkert. “They often have Covid-19 infection without a body temperature of 38 degrees.”

Nineteen elderly

Geriatricians at the Elizabeth / Tweesteden Hospital in Tilburg already noticed this phenomenon in March. They decided to quickly collect examples together with Olde Rikkert and colleagues. In the Dutch (Journal of Medicine2 (NTVG) they described the first nineteen elderly who were admitted to hospital having tested positive for Covid-19 in Tilburg and Nijmegen. What turned out? “Of the nineteen very old patients, hardly any of them had two typical Covid-19 phenomena. At the most one. So they did not have the combination of symptoms that officially indicates Corona: 38 degrees fever, dry cough, shortness of breath. No, they sometimes had something completely different: they had delirium (acute confusion) or had fallen.”

The article, a “clinical lesson,” is the best-read piece online about corona at the NTVG, as more and more GPs saw sick old patients who didn’t understand what was wrong with them. And they did not qualify for a corona test at the GGDs without a high fever and cough, or two other “typical corona symptoms”.

Another difference with young people is that the immune system works less well in the elderly person. Olde Rikkert: “An attack by a flu virus or a virus like corona causes the older person’s immune system to become in the highest state of activity, but it does not fight effectively. There is a kind of immune storm, an overkill, and those can no longer be handled by the heart, lungs and brain (delirium).”

According to Olde Rikkert, policymakers looked at everyone in the same way in the corona crisis. “You really have to look differently at the elderly, they are constructed differently.”

Counting the dead

In the meantime, all nursing homes in the Netherlands have been closed by emergency ordinance since March 20. Visitors are no longer welcome, because nursing homes turned out to be real sources of infection. Family unwittingly brought the virus in and out. The elderly infected each other, and carers became infected. The strongest distribution occurred in wards for residents with dementia. Olde Rikkert: “If someone is demented, they don’t understand the isolation measures. It is difficult to separate a close-knit living group in a psychogeriatric ward.”

At the same time, corona deaths in nursing homes were not tracked. Because a large proportion of the sick elderly people had not been tested for the virus, they did not count in the RIVM1 statistics. They were not eligible for a test. Or two sick elderly people were tested in a ward and the other sick in that ward were also believed to have Covid-19. Verenso, the association of specialists in geriatric medicine, has started to do that from the end of March. “It is best to test because then you also know how to treat a patient and you can use protective equipment,” says Olde Rikkert.

In the back of the row

And perhaps most importantly, says Olde Rikkert: in March and April, the nursing homes were in the back of the line when the masks, aprons and glasses were distributed. The bulk went to hospitals. There was too little of everything. So little that the guidelines of the RIVM1 were adapted to it: “nursing home staff only work protected if the client is infected (or is suspected of it).”

It was not until April 20 that nursing home staff were given the right to be tested for corona immediately if in doubt. On April 23, a geriatric specialist was added to the experts from the Outbreak Management Team who informed the House of Representatives.

Vaccine

And even as scientists worldwide search for a corona vaccine, the older human body is forgotten, says Olde Rikkert. “All vaccine tests are done in people in their fifties! Those are the people who report for research. If you take a little more time and also test for those over eighty you may get a vaccine that will benefit the elderly. But it has to be done quickly, quickly.”

The goal should not be that vulnerable elderly survive as much as possible, he says. “Elderly medicine should add life to the days of old people and not add days to life. At COVID-19 you must therefore support the resilient, biologically young elderly in survival and also support the weaker elderly well by relieving the symptoms. If the latter succeeds, COVID-19 can also be “the old man’s friend”, as William Osler called pneumonia 100 years ago.”

He expects the “excess-mortality” of these months by the coronavirus to be followed by an “under-mortality”. “The people who would otherwise have died in the coming year have already gone.” And the elderly who survived Covid-19 will all be weakened. “People who have been infected are left with damage. People who are not infected but who are socially isolated also lose out. It has been proven to deteriorate your immune system.”

Not to mention loneliness in the precious time that the elderly have left. The elderly have been alone for a long time due to the intelligent lockdown. That is a paradox. Olde Rikkert ,”Because it is also the love for grandpas and grandmas, fathers and mothers, that is the cork that keeps the willingness of young people to engage in social distancing afloat.”


Notes

  1. RIVM is the abbreviation for National Institute for Public Health and Environment in the Netherlands 
  2. 2. (https://www.ntvg.nl/artikelen/atypisch-beeld-van-covid-19-bij-oudere-patienten/volledig)
Benchmarking with InterRAI data

“When you compare yourself with others, your only options are arrogance or self-defeat”
– John Spencer

I came across the quote above in a blog post by educator and maker John Spencer.  He is writing about personal self-doubt, but I believe the quote applies equally well to organisational self-doubt, especially in healthcare (@helenbevan).

Benchmarking is often portrayed as an instrument to stimulate learning and improvement, but quite often the opposite is the case. I think the quote reflects this problem well. The self doubt begins when we are at school, when the results of our essays and exams are publically displayed. Personally, I was often in the bottom part of the list. That position did not encourage me to work harder. Rather, I became familiar with a sense of defeat.

In healthcare, we often see a similar reaction when confronted with our own results, in comparison with the national average. I have yet to meet a manager or CEO who was inspired by benchmarking results to improve their performance. 

It all depends on how we benchmark. Presenting results in a bar graph, from low to high with the median as a line across, is the easiest way. However, these types of visualisations inspire arrogance or a sense of defeat. They tend to convey false messages, depending on which side of the line you find yourself. Even if there has been huge improvement, the ruthlessness of that median line will  leave you with a “pass” of “fail” feeling.

In my humble opinion there is a much better way to benchmark — one that has a greater chance to encourage and inspire organisations to improve. The key aspect is to take into account variation in the data.

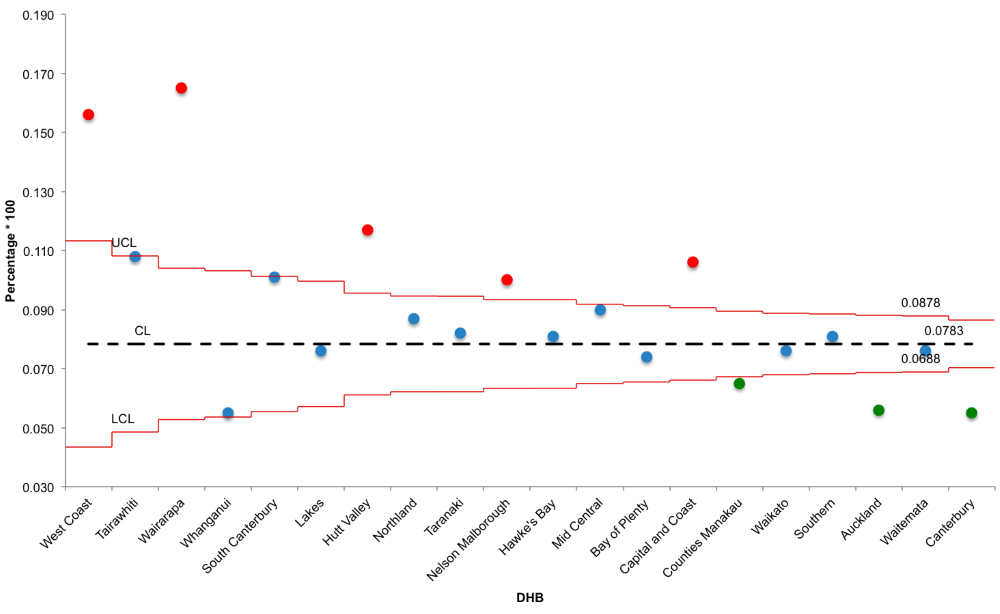
Fig 1. Ranking of the percentage of InterRAI assessments in aged care facilities per DHB where the delirium CAP was triggered in the period 2018-2019. (Source: InterRAI website New Zealand (https://www.interrai.co.nz/data-and-reporting/)

The kind of visualisation I am talking about here is called a funnel plot. This displays results either outside the funnel (statistically significant, in relation to the mean) or within the funnel (insignificant, in relation to the mean). This leads to narrower control limits when a smaller variation in the data is expected (larger population) and wider ones when a larger variation is expected (smaller population). It is an approach that produces a balanced view, helping organisations avoid false assumptions about their work.

The funnel plot below shows that the majority of DHBs are within the funnel, indicating that there is no statistical difference in their distance from the mean value of 7.8%. Only five DHB have a significantly higher percentage (red bullets) of assessments that triggered the delirium CAP. Another three have a significant lower percentage (green bullets) and are located outside the funnel.

Fig 2. Funnel plot displaying the percentage of InterRAI assessments in aged care facilities per DHB where the delirium CAP was triggered in the period 2018-2019. (Source: InterRAI website New Zealand (https://www.interrai.co.nz/data-and-reporting/)

In conclusion, funnel plots are a useful visualisation tool which provide a balanced view on how different units (organisations/ facilities / DHBs etc) are performing, when compared with each other. They stimulate a validated learning process (what are the green bullets doing? What can the red ones can learn from this? Why are the greens doing so well?). This helps avoid feelings of arrogance or defeat.

The challenge for improvement is to get most of the unit results within the funnel. This is followed by aiming to reduce or increase the mean (CL), depending on what you want to achieve. This is achieved by introducing changes in the care process by using the model for improvement (PDSA cycles).

Data collected through the InterRAI assessments can be used for this purpose, particularly the CAPs and the outcomes measures. These provide a wealth of useful information. Unfortunately, accessing and analysing raw interRAI data requires certain skills. Care-Metric has these skills: we can provide you with visualisations that tell your story. We analyse your data on the requested topics and create different types of visualisations, ones which display meaningful results in a storytelling format. This provides relevant information to those working directly with the residents, as well as management and the board.

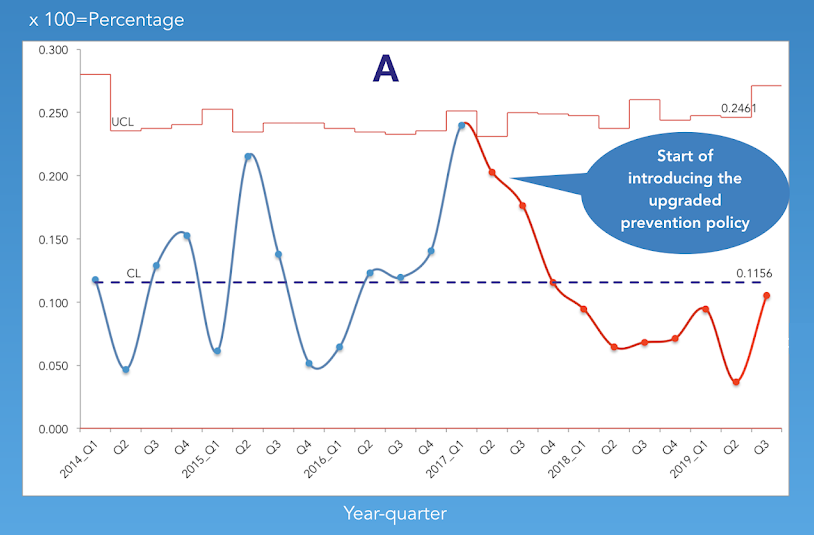
See below an example visualisation of how a change in the process of preventing pressure injuries resulted in a reduction in the number of pressure injury L1 and L2 CAPs triggered.

Triggered pressure injury CAPs (L1-L2) have come down after upgrading prevention policy

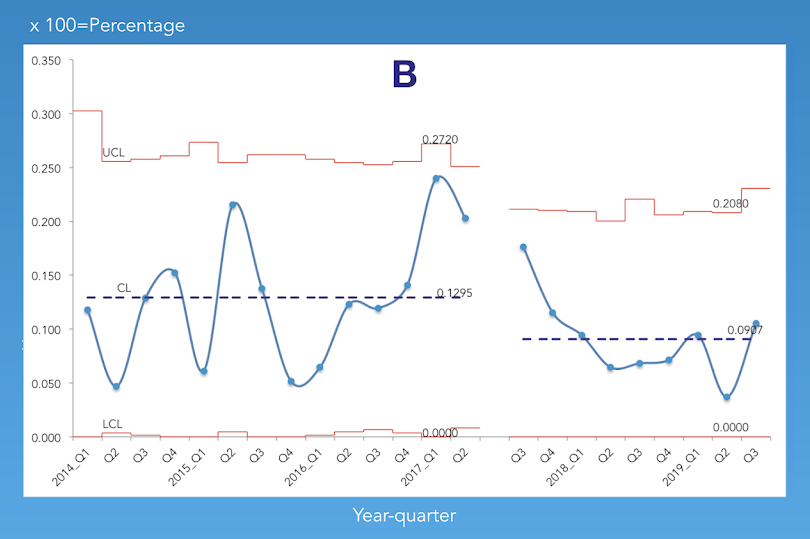
Percentage of quarterly InterRAI assessments that triggered the pressure injury CAPs L1 &L2

The story

With the introduction of the upgraded prevention policy, the number of assessments that triggered the pressure injury CAPs L1 and L2 has been significantly reduced (A). Critical aspects in the upgraded policy that are responsible for this achievement, are the introduction of the adapted risk assessment tool, combined with the daily clinical skin assessment and the use of new pressure reducing standard mattresses for the whole facility. These interventions reduced the prevalence rate with 4 % from 13% to 9%. Congratulations!

The success of the introduction of the upgraded policy created a new baseline (B) for the future. Our aim is to reduce the Pressure Injury L1 and L2 even further. Our aim is to keep the Pressure Injury prevalence below the average of 5%. To achieve this, requires everyone’s (healthcare assistants, registered nurses and management) attention to the process of prevention and risk assessment combined with taking adequate and timely preventive measures. Furthermore it requires daily monitoring if the provided measures effective prevent the development of pressure injuries in the resident.

Note. For this analysis a P chart was used. UCL = Upper Control Limit. CL = Central Line. LCL = Lower Control Limit. Due to the small number of quarterly observations the LCL is not always visible.

Please contact Care-Metric for more information on how to optimize the use of your InterRAI data.

Aged care facilities are doing a better job

Care-Metric, in collaboration with the DAA Group and Massey University, has undertaken a study of audit results for aged care services. The study (see Abstract below) shows that compliance with the standards of care in aged care facilities has improved over four years.

The study, which has been published in Kai Tiaki Nursing Research, looked at 185 aged care facilities that were audited in 2016 and compared the results with their previous audit. The results are good news for residents, family and staff. The scores were not influenced by which organisation performed the audit, and this demonstrates the robustness of the outcomes.

The review of audit outcomes by DHB regions shows that facilities in the Northern and Southern region showed a significant improvement in the overall scores. This was in contrast to those in the Midland and Central region. Of the six standards contained within the Health and Disability Services Standards, four significantly improved and two did not (Organisation Management and Restraint Minimisation and Safe Practice). Of the six standards, Organisation Management and Continuum of Service Delivery had the lowest scores.

The study in itself is unique for several reasons:

  • A similar study has never been published in New Zealand before;
  • It shows the power that publicly available data has;
  • It provides direction on which parts of the standards the sector need to focus on (ie Organisation Management, Continuum of Service Delivery).

Interestingly, improved compliance with the standards has not led to an increased perception of the quality of care by the public, as seen in recent media reports. This demonstrates the limitations of the audit process, which is only one item in a toolbox of tools to monitor the quality of care. The authors suggest, therefore, that measures that are observable and relate to the concept of quality of care of the general public (e.g. nutrition, continence and pain management, prevention of falls and pressure injuries and wound care) should be incorporated into the monitoring processes. This could be a first step in closing the gap in the perception of performance between the age care facility and the public that they serve.


What factors influence compliance with health and disability service standards for aged residential care in New Zealand?

ABSTRACT

Aims: To identify compliance with the New Zealand government’s health and disability service standards (HDSS) in aged residential care (ARC) facilities in 2016, compared with previous years’ outcomes, and its relationship with the surge of complaints in the public domain.
Methods: The 2016 audit reports of 185 ARC facilities were compared with their previous audit reports. The level of attainment of the different service groups was quantified (5:continuous improvement — 1:unnattained).
Results: Audit reports of 185 facilities were included for analysis. Overall, the compliance with the standards improved from an average of 3.59 (plus or minus 0.80) to 3.76 (plus or minus 0.71). All service groups improved significantly over time, except for organisation and management. Number of beds and audit agency had no significant influence on the outcomes.
Conclusions: Compliance with the HDSS of the ARC facilities audited in 2016 significantly increased from their previous audit. There appears to be a discrepancy between the outcome of this study and the perception of the public; however this study could not draw conclusions whther this this discrepancy is directly related to an increase in poor performance. The question emerges whether the current standards reflect sufficiently the provision of good quality care.

Weststrate J, Boamponsem L, Cummings L, Towers A. (2019) What factors influence compliance with health and disability service standards for aged residential care in New Zealand. Kai Tiaki Nursing Research, 10(1), 31-37.


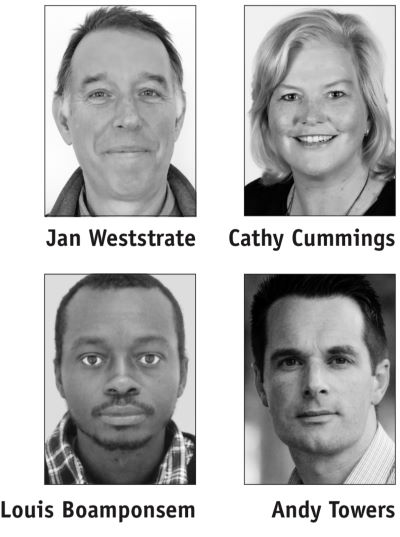
About the authors:
Jan Weststrate, RN, PhD, is a director of Care-Metric (health service quality improvement advisers), Raumati, New Zealand. His correspondence address is: Jan@care-metric.com
Louis Boamponsem, PhD, is a quality assurance officer for the Laura Fergusson Trust (rehabilitation and support services), Canterbury & West Coast, New Zealand.
Cathy Cummings, RN, DBA, is director and specialist advisor for the DAA Group (health certification and accreditation), Wellington.
Andy Towers, PhD, MA, is a senior lecturer in the School of Health Sciences, Massey University, Palmerston North, New Zealand.

Are pressure injuries on their way out?

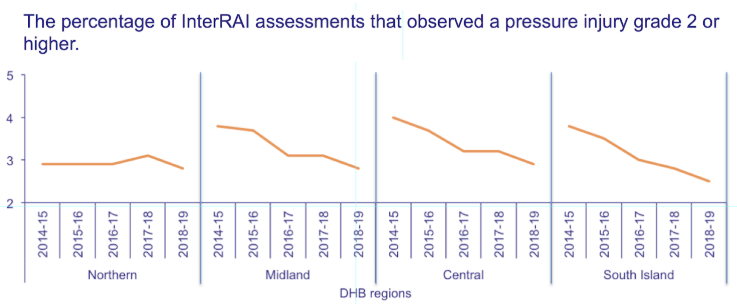
Pressure injuries are still a hot topic in New Zealand. Care-Metric was interested to find out whether the problem was increasing, stabilised or decreasing in the aged care sector. For this we studied the interRAI data, which is publically available here: https://www.interrai.co.nz/data-and-reporting/In order to create a meaningful graph that tells this story, we created a panel graph that displays the percentage of interRAI assessments that observed a pressure injury grade 2 or higher per region since 2014.

The story

Overall the number of pressure injuries observed during InterRAI assessments has decreased. The South Island experienced the largest decrease, a reduction of 1.3%. The northern region experienced the smallest decrease (0.1%). Most likely this region was ahead of the game due to the “First Do No Harm” programme, which has been in place since 2012 and involves regional aged care facilities.

Conclusion

Pressure injuries in the aged care sector have decreased. This did not happen overnight — it has been a gradual process. With continuing education, financial support for using pressure reducing equipment, incident reporting and measuring prevalence/incidence, this trend could continue.